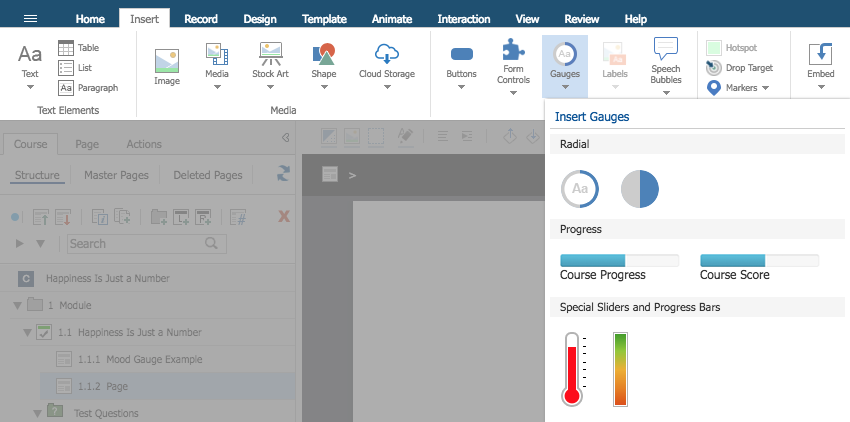
If you take a peek at the Insert Tab in Flow You’ll see a button Gauges, which has options you can use to visually display data in any project in Flow:
"En-gauge-ing" your learners (or, Happiness is Just a Number)

A lesson on using a Mood gauge
When you add a gauge to a page, it automatically adds an accompanying/connected Variable to your page (and course as a whole). Manipulating that variable is how you manipulate what the gauge displays.
You can use all kinds of user-actions to set or increase or decrease these variables.
Let’s walk through an example using a Mood gauge. We’ll set up two buttons, one for Happiness and one for Sadness. The buttons will increase or decrease the variable value, which will then be reflected by the Mood gauge on the page.
The basics we’ll cover can be adapted to any of the gauge types.
A bit of prep work
Here’s some preparation work we did to get started:
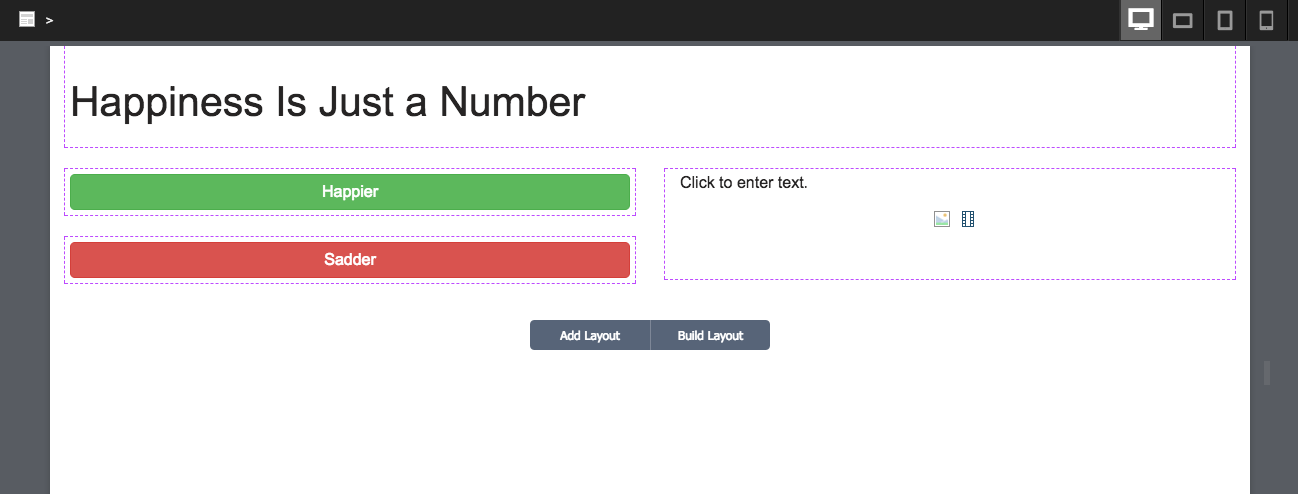
- We created a new project for this activity. We chose to make a course and called it “Happiness Is Just a Number.”
- We used a Header and Two Col layout on our page.
- We added “Happiness is Just a Number” to the Header field on the page
- We added two buttons to the left-hand Group on the page. We named one “Happier” and set it to be green on the Style tab. We named the other “Sadder” and set it to be red on the Style tab. We set both buttons to be Full Size on the Format tab.
- We also gave both buttons unique names in the bread crumb list, “HappierButton” and “SadderButton”.
After the prep work, we had a Page that looked like this:
Adding the Mood gauge
So, let’s add the gauge to the right-side group on the page.
Here are the steps to do that:
Use the Full Screen button to view this lesson in a modal window.
Click here to view the Guide version of these steps.
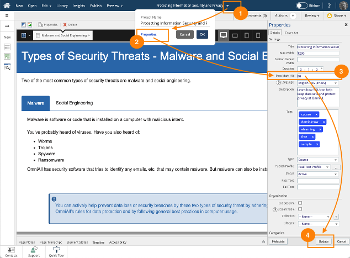
On the Format tab let’s check a few of the Mood Gauge’s settings.
First, let’s confirm the Range values. The Range values set the maximum and minimum values that the gauge’s variable can have as well as the increments by which it can increase and decrease.
For this lesson, make sure these are the values shown:
- Min: 0
- Max: 10
- Step: 1
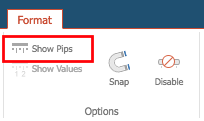
Let’s have the Mood gauge show the divisions that represent each Step, so we can have a clearer visual representation of the value being displayed. To do this, select the Show Pips button in the Options section:
Connecting the Mood Gauge and the buttons
All right, let’s get to the good stuff: making things happen on the page.
Let’s set the Happier button to increase the Mood gauge’s variable every time we click it.
Here are the steps to do that. In step 5, the variable you want will be named Slider1 (or SliderN, if you've added more than one to your project):
Use the Full Screen button to view this lesson in a modal window.
Click here to view the Guide version of these steps.
To see it all happen, do a Full Course Preview. Try using the buttons to observe the change in the Mood Gauge.
Happy now you know
The variable for the mood gauge is available across all the pages in your project.
So instead of having the buttons on the same page as the gauge, you could easily have the learner selecting buttons throughout the project then showing the Mood gauge as a summary at the end.
Or you could have the Mood gauge in a Footer at the bottom of each page, to provide your learners with ongoing feedback.
And there are so many other things you can do.
What can you dream up?


Comments ( 0 )
Sign in to join the discussion.