You can view your Convey usage at anytime using the Analytics for Convey Dynamic Publishes report.
Report - Analytics for Convey Dynamic Publishes

Product: dominKnow | ONE | Version: 7.4
Applies to: Flow, Claro
Applies to: Flow, Claro
Report - Analytics for Convey Dynamic Publishes
Quickly view and export statistics for your team's Convey usage
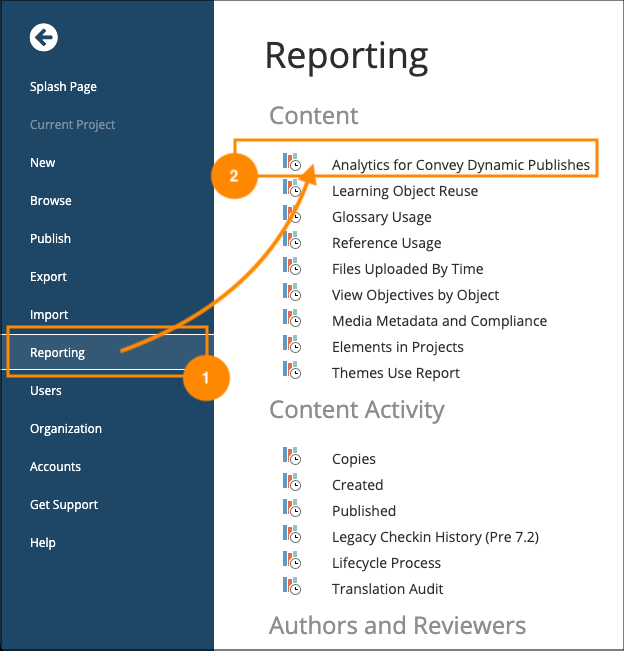
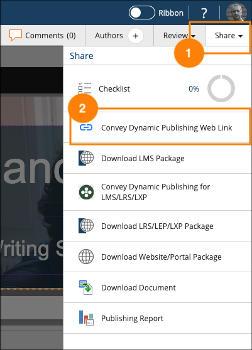
Under the Application Menu, select Reporting (1) then Analytics for Convey Dynamic Publishes (2).
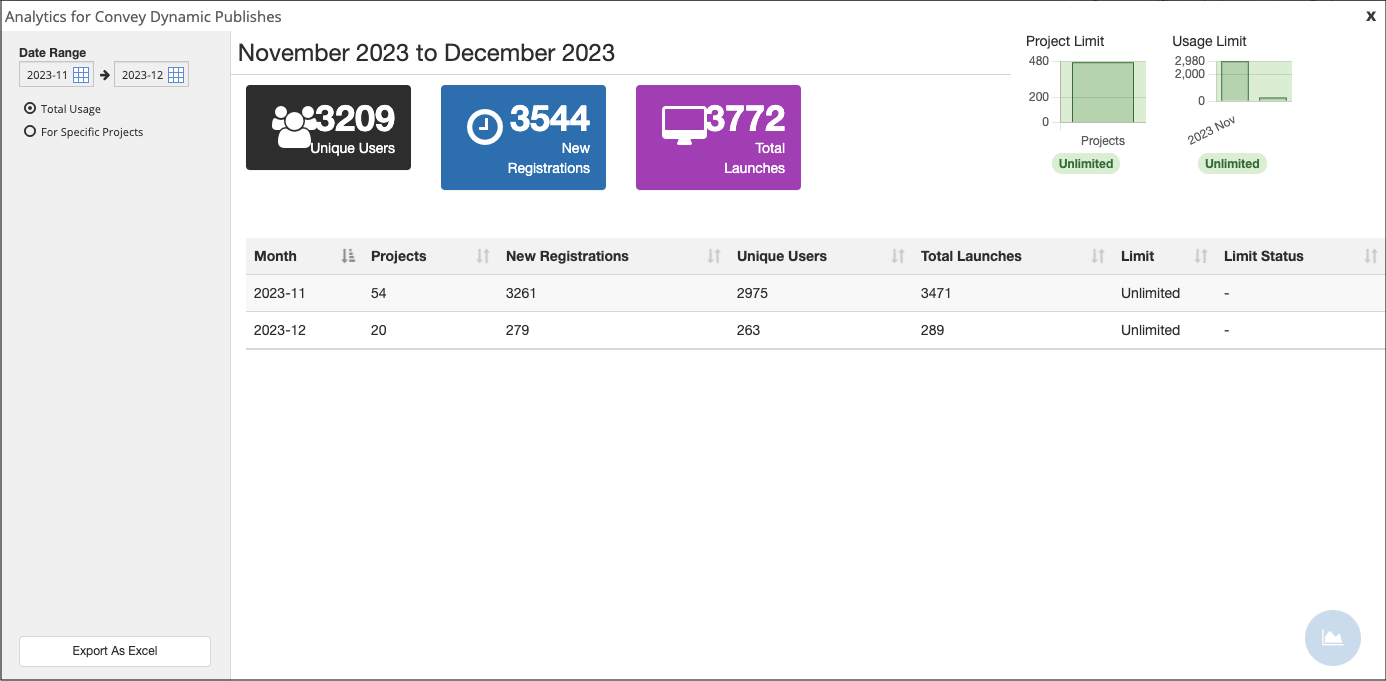
Total Usage
The default display is for Total Usage for a specific time period.
In the upper left corner you can set a date range, based on full months.
The main display has panels that highlight:
- Total Unique Users
- Total New Registrations
- Total Launches
You will also see a month-by-month break down in table form.
In the upper right of the display are two quick-glance status indicators for your usage limits.
In the lower left corner, you can export the data displayed in the main panel as an Excel file.
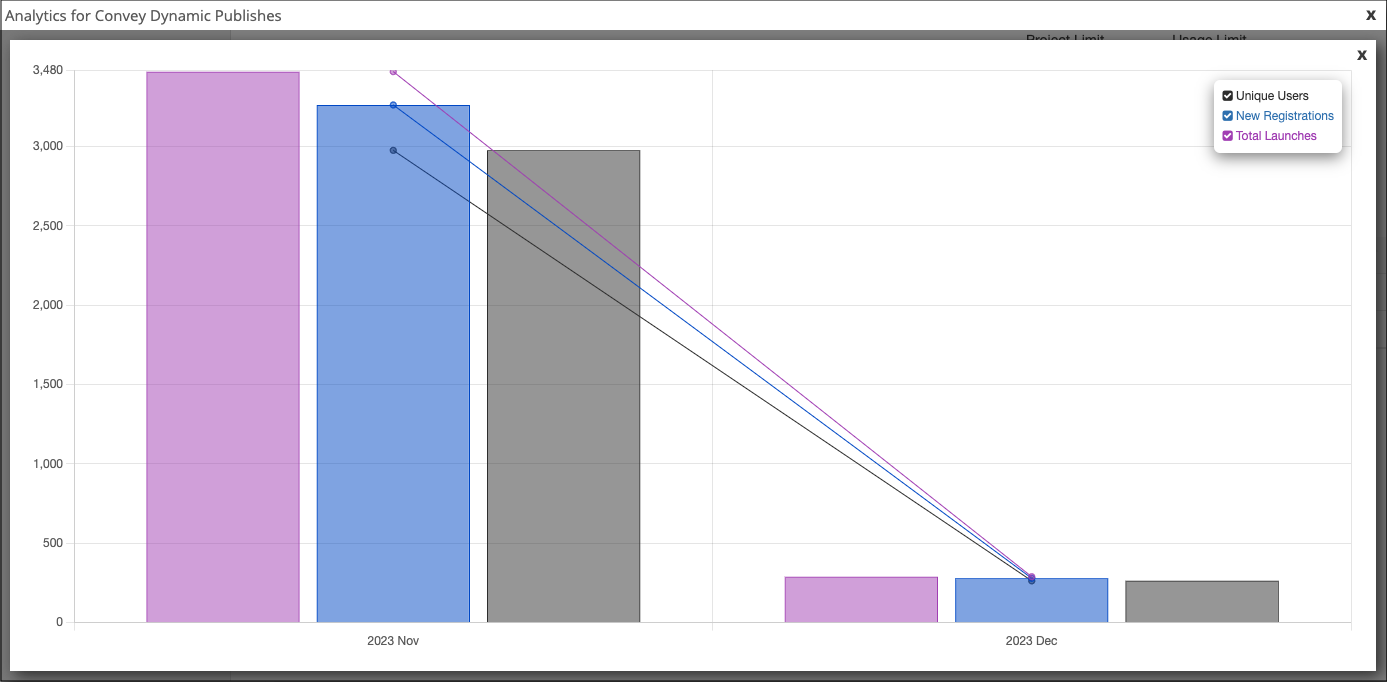
If you select the circular chart icon in the lower right corner, the table data will be displayed in a chart.
In the upper right corner of the chart display you can select/deselect to change the chart display.
You can choose from any combination of Unique Users, New Registrations and Total Launches.
For Specific Projects
To dig in deeper, in the upper left corner of the default display you can select the For Specific Projects radio button.
On the left side of the display you can use the Project Filters to focus the data displayed in the table.
The table in the main display will now show Project-based data.
In the lower left corner, you can export the data displayed in the main panel as an Excel file.
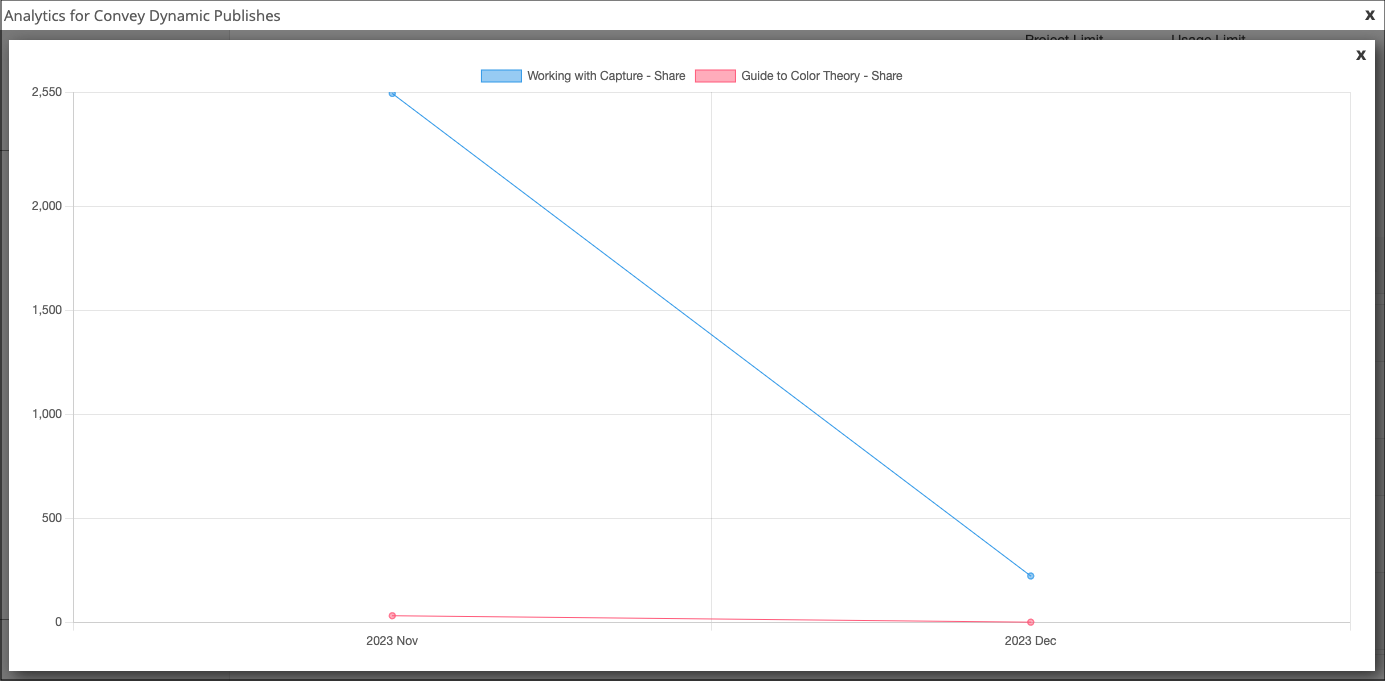
If you select the checkbox beside one or more projects you can use the Chart option in the lower right corner to view a chart display of the data for the selected projects.
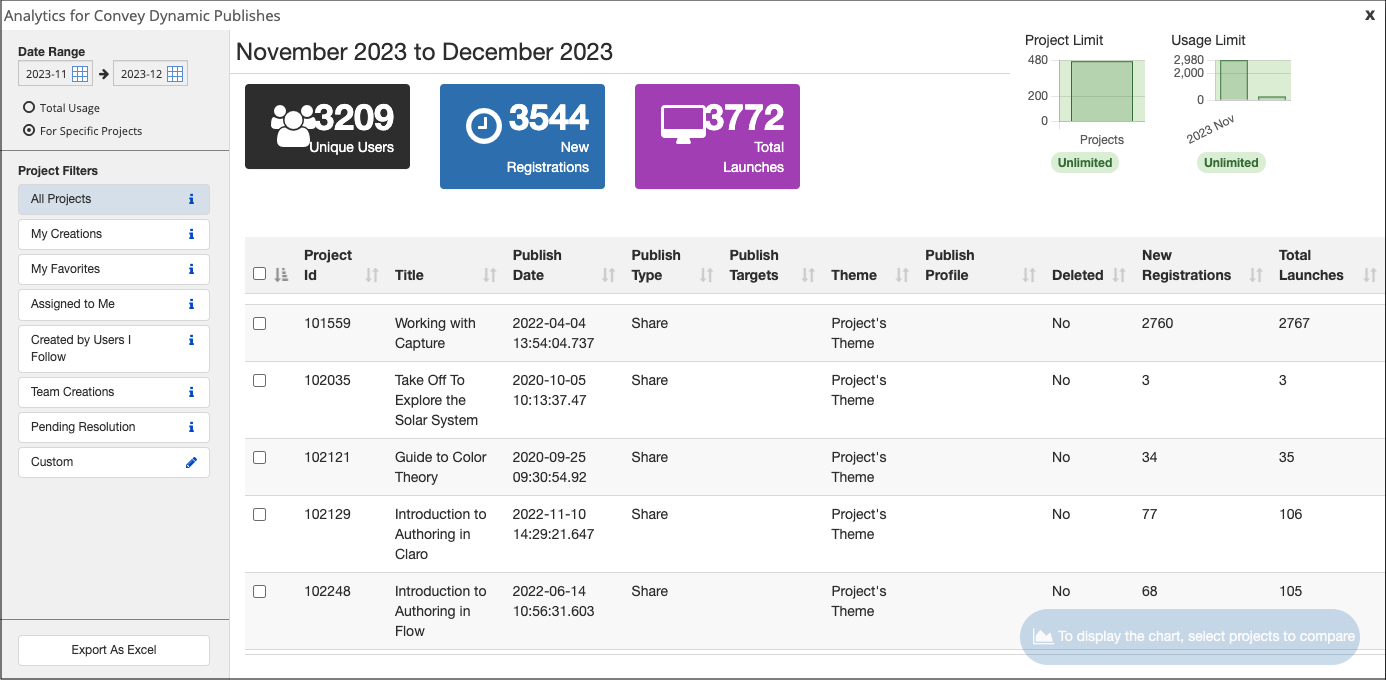
This chart lets you compare trends for each Project selected, with a Color-coded legend displayed at the top.


Comments ( 0 )
Sign in to join the discussion.